Zerodha Shows a Dash Where Your XIRR Should Be — Here's Why
Zerodha's Holdings page has an XIRR field. It shows '–'. This isn't a bug — it's a fundamental limitation. And even if they fix it someday, the number will still be wrong.
Open Zerodha's Holdings page and look at the top right of your summary card. You'll see four numbers: Invested, Present Value, Unrealized P&L, and XIRR.
That last one shows a dash: –
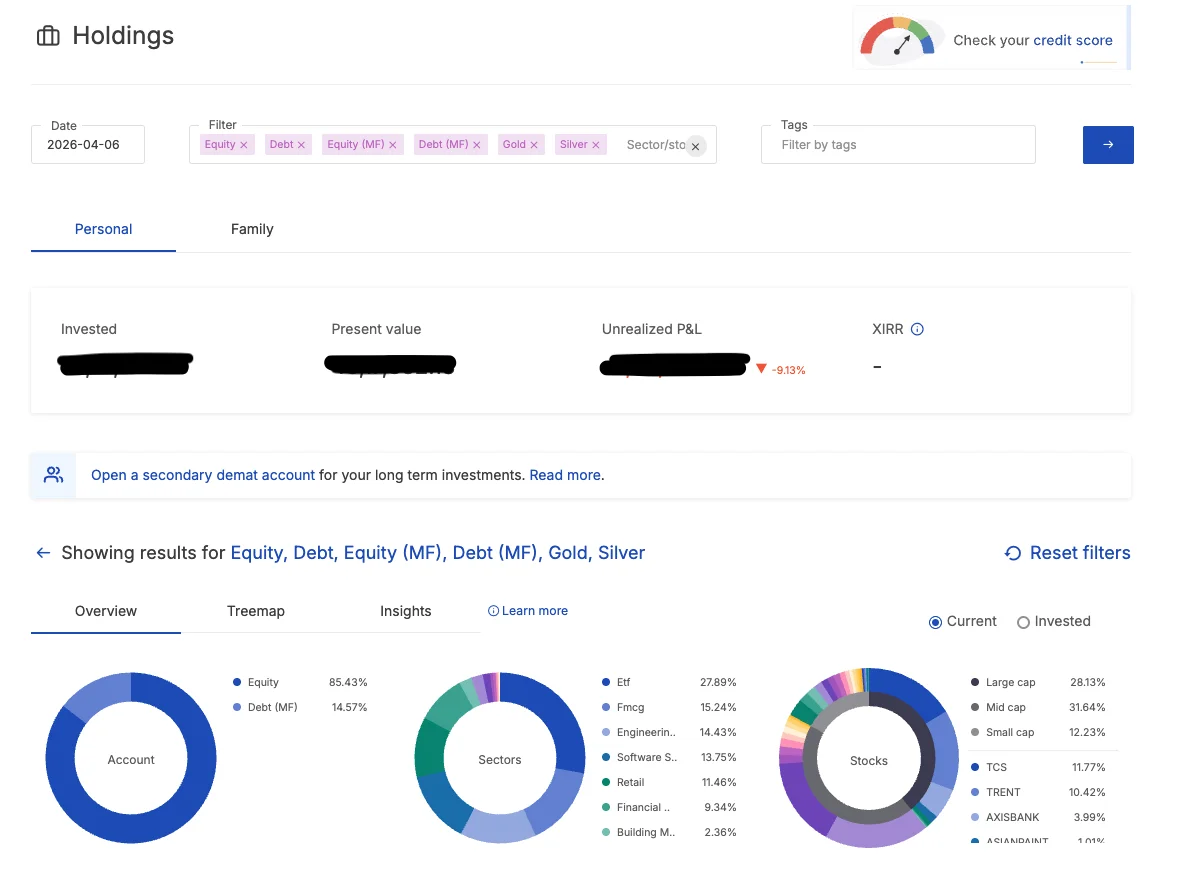
Not zero. Not even an error message. Just a dash — as if the field doesn't apply to you.
It applies to you. Zerodha just can't calculate it.
Why the Dash Appears
XIRR is not a simple percentage return. It's a time-weighted, cash-flow-based annualised return. To calculate it, you need to know:
- Every rupee you put in, and on exactly which date
- Every rupee you took out, and on exactly which date
- Your portfolio's current value, as the final inflow
The third piece — current value — is trivially available to Zerodha. They know your holdings.
The first two pieces are the problem.
Your cash flow history lives in your ledger: every bank transfer you made into Zerodha, every withdrawal you made out, every dividend credit, every charge deduction. That's a long, messy record, and it differs for every user depending on when they opened their account, how many times they've added or withdrawn funds, and whether they've ever reinvested proceeds.
Computing XIRR accurately across all of that — for millions of accounts, in real time — is a genuinely hard problem. So Zerodha shows a dash instead.
To be fair, they've acknowledged this. On their support pages and community forums, Zerodha has stated that XIRR calculation requires complete fund flow data which they're working on. The field exists as a placeholder. The number does not.
"But What If They Fix It Someday?"
Fair question. Assume Zerodha eventually figures out the engineering and starts showing a number where the dash is today.
It will still be wrong.
Here's why: even if Zerodha correctly accounts for every bank transfer in and out of your account, there's a layer of costs that sits below the fund-flow level. These are the charges deducted on every trade:
- Brokerage — ₹0 for equity delivery (Zerodha charges nothing), but ₹20 flat per executed order for intraday and F&O
- STT — 0.1% on both buy and sell for delivery; 0.025% on sell side for intraday; 0.02% on F&O futures sell; 0.1% on options sell (on premium)
- Exchange transaction charges — NSE charges ~0.00322% on delivery trades
- SEBI charges — ₹10 per crore traded
- GST — 18% on brokerage + exchange charges
- Stamp duty — 0.015% on the buy side for delivery
Even on a delivery trade where Zerodha charges ₹0 brokerage, you're still paying STT, exchange charges, SEBI fees, GST on those, and stamp duty. The brokerage waiver doesn't make the trade free — it just removes one line item.
When you buy ₹1,00,000 worth of stocks on delivery, Zerodha's ledger shows a debit of roughly ₹1,00,187. That ₹187 is real money that left your account — STT, exchange fees, SEBI charges, GST, stamp duty — and it directly reduces your net return.
A holdings-based XIRR (calculated from trade prices) records ₹1,00,000 as your cost. A ledger-based XIRR captures the full ₹1,00,187 debit — because that's what actually left your account.
The difference matters. Let's look at it over a real portfolio.
The Charges Add Up More Than You Think
For a typical ₹50,000 delivery trade on Zerodha (₹0 brokerage):
| Charge | Rate | Amount |
|---|---|---|
| STT (buy + sell) | 0.1% each way | ~₹100 |
| Exchange charges | ~0.00322% | ~₹32 |
| SEBI charges | ₹10/crore | ~₹1 |
| GST on above | 18% | ~₹6 |
| Stamp duty (buy) | 0.015% | ~₹8 |
| Total | ~₹147 |
For an F&O options trade at ₹20 brokerage, add another ₹20 per leg — plus significantly higher STT on expiry.
| Annual trades | Avg charges per trade | Annual drag |
|---|---|---|
| 20 delivery trades | ₹150 | ₹3,000 |
| 50 delivery trades | ₹150 | ₹7,500 |
| 50 intraday/F&O trades | ₹300 | ₹15,000 |
On a ₹20 lakh portfolio, ₹7,500 per year in charges works out to a 0.375% annual drag on your returns. Over 5 years with compounding, that's the difference between 12% XIRR and 11.6% XIRR — and it grows the more actively you trade.
If you're using your XIRR to benchmark against Nifty 50 — which returned roughly 12–14% XIRR over the last decade — a 0.6% gap is meaningful. It can be the difference between "I'm beating the index" and "I'm just matching it."
For F&O Traders, It's Much Worse
Futures and options carry heavier charges, particularly STT on options expiring in-the-money. Many F&O traders track their profit per trade and believe they're net positive. When they see the full ledger XIRR — including every charge on every contract — the reality is often uncomfortable. Some are net negative on an annualised basis after costs, even in years where individual trades felt profitable.
Holdings-based XIRR would miss this entirely.
What Correct XIRR Calculation Actually Requires
To get a number you can trust, your XIRR calculation needs to be built on actual cash flows — the exact amounts that moved in and out of your account, not the face value of trades.
This means:
- Use your ledger, not your holdings list
- Every bank transfer in is an outflow (you deployed capital)
- Every bank withdrawal is an inflow (you recovered capital)
- Every charge, tax, and fee is captured automatically — because the ledger reflects the net debit, not the gross trade value
- Dividends, SGB interest, and corporate action credits are inflows
The ledger is the complete financial record. Holdings are a snapshot of one dimension of your portfolio — current positions. Holdings alone cannot give you XIRR.
The Ledger-Based Approach
This is exactly why XIRR Ledger is built the way it is. Instead of asking you to enter your holdings or current value manually, it asks you to upload your broker's account ledger — the CSV file that Zerodha, Groww, and Fyers provide on their platforms.
Every transaction in that file is a data point. The XIRR is computed from the actual cash flows, not from estimated position values. Every charge that Zerodha deducted is already baked into the numbers, because the ledger recorded the net debit.
The result is the number that matters: your real, after-cost, time-weighted annualised return.
Not an approximation. Not a placeholder. Not a dash.
Want to see your actual XIRR — including all charges? Calculate now →
See what a full report looks like Download Sample Report →
Ready to Calculate Your True XIRR?
Upload your ledger and get accurate returns in minutes